A Better Phonetic Alphabet
This is a collaboration with Tomer Braff (@Jumplion) whom I met in the Summer of Math Exposition community.
A phonetic alphabet, also known as a spelling alphabet, is used to distinguish letters when spelling out words. Letters are given names, like Alfa, Bravo, Charlie, and so on…
We wanted to know if there is a combination of words that is even easier to tell apart by their pronunciations.
Phonemes
Words are sequences of vowel and consonant sounds. We call these sounds phonemes, they are the building blocks of speech.
The CMU Pronouncing Dictionary provides a large list of words with their pronunciations described in phonemes.
In order to know which set of words sounds the most different from each other, we need to quantify how similar two phonemes sound.
Tomer recorded each phoneme with his voice and created a dataset for subsequent similarity analysis.
How we hear
I used CoNNear to simulate how the cochlea
in our ears would respond to each phoneme sound. Here’s it’s output for the EY phoneme:
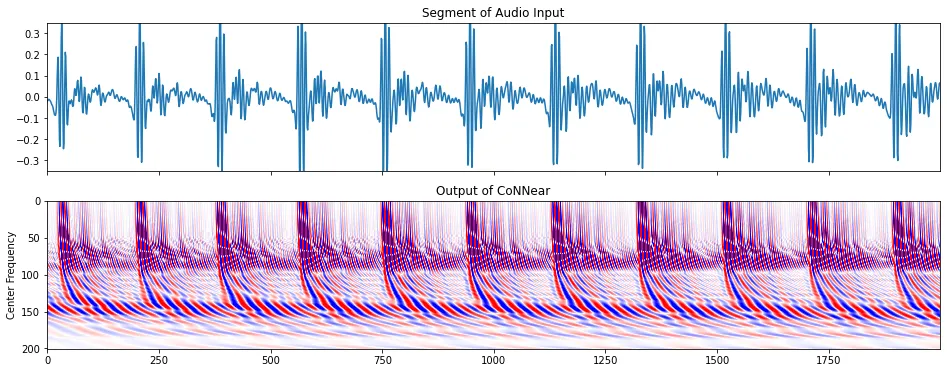
The cochlea in our ears has a tapering basilar membrane. When we hear a sound, different parts of this membrane vibrate based on the frequencies present in the sound.
The thicker parts of this tapering membrane resonate with lower frequencies, while the thinner parts resonate with higher frequencies. Indeed, our ears perform an analog variation of the Fourier Transform for every sound we hear!
Based on prior research about which frequencies we can tell apart, the model’s frequency axis is divided into 201 bins. Across time, each bin oscillates back and forth (blue and red) about its mean position (white).
The benefit of using CoNNear over a DFT is that we can work with a representation that is very close to how we perceive sounds.
Creating a phoneme distance function
There are a few different ways we could go about this. Given that phoneme sounds are very short, and
that they are usually static sounds, I decided to aggregate the CoNNear output over time. Here are
the frequency distributions for AA, AE, and L respectively:
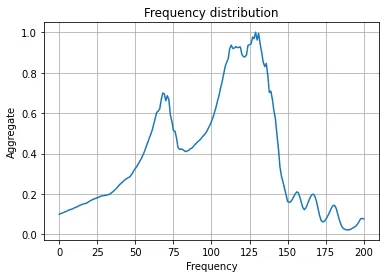
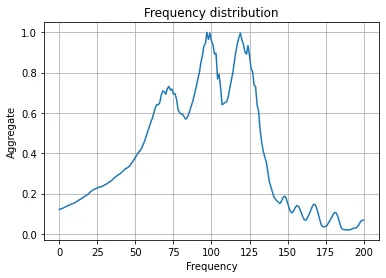
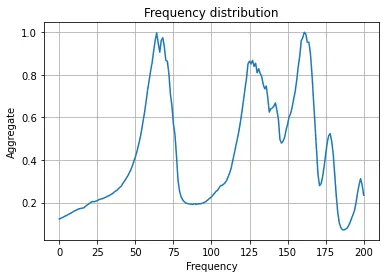
Notice how AA and AE have similar looking frequency distributions, while L looks different
from them.
If we consider each frequency bin to be a dimension of a vector space, then our frequency distributions become 201-dimensional vectors.
The similarity between two phonemes is then simply the Euclidean distance between their vectors.
Finding better phonetic alphabets
Tomer used this similarity infomation and the CMU Dictionary to find the most distinct sounding alphabet using various graph search algorithms.
More about that and our results are in his video A Better Phonetic Alphabet? which became an entry for the Summer of Math Exposition 4.
Closing words
I was not sure if it would even be possible for me to make a similarity function for the phonemes. Tomer encouraged me to go for it, and said that anything I’d make would be appreciated. And I’d like to think the method we found is quite neat!
There are still things we can improve. For example, we can include temporal information of each phoneme recording, because not all of them are really static. We have some work on a follow up, and we hope we can share its story another time.